Lynn Marentette, M.A., Sp.A., Learning Experience Designer, NUITEQ®
“The experienced physician, mechanic, or physiologist looking at a wound, an engine, a microscopic preparation, "sees" things the novice does not see. If both, experts and laymen, were asked to make exact copies of what they see, their drawings would be quite different” - Rudolph Arnheim, Visual Thinking.
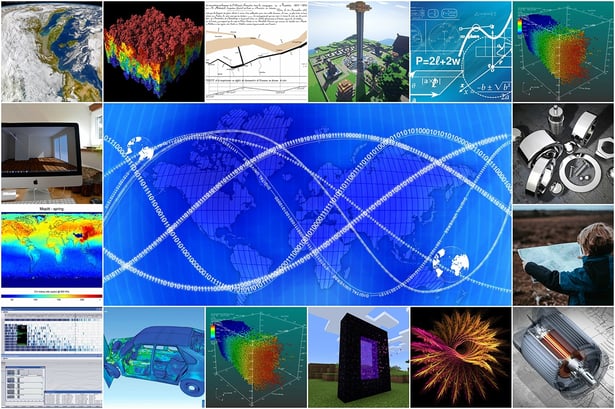
Over the past decade, technological developments have transformed teaching and learning in many classrooms. Textbooks, the centerpiece of traditional schooling, now come in digital form, with links to interactive websites loaded with images, videos, simulations, and in some cases, games. Teachers use interactive displays to present visual and multimedia content. High quality content appeals to students, and done well, can increase engagement and retention of knowledge.

In today’s world, students still rely on reading skills to learn. They also rely on oral and written skills to convey what they’ve learned to others. However, learners of all ages rely on visual thinking skills to obtain deeper understanding of concepts. To understand and create visual representations of knowledge, students require opportunities to learn about them, and learn ways to develop their visual analytical skills, just as they require instruction in how to read.
Below is a summary of research and current educational practices that highlight what we know about visual learning and thinking:
- Visual information is processed more quickly than text.
- Students write more, at a higher level, as a result of discussions using visual thinking strategies.
- Students benefit from interaction with multiple representations of information and concepts more than through text or lectures.
- Visual thinking is an important process. When people use visual thinking skills, it helps them learn about complex systems. In many cases, visualizations convey more meaning than verbal descriptions alone.
- Visual diagrams, graphic organizers, and concept maps help people problem-solve, and support group work.
- Visualization tools are not limited to scientific fields. People across many fields of work rely on them. For this reason, researchers recommend that visualization methods be used in education, across many subjects.
- Creating visual explanations improves retention of information and deeper understanding of complex concepts. For this reason, students benefit from learning visual thinking and communication skills.
- Research in science education supports bringing “science to life” through interactive diagrams, concept maps, videos, simulations, virtual reality, augmented reality, and games.
Visualizations can be used to support visual thinking and learning across all subjects. Below are two examples:
History
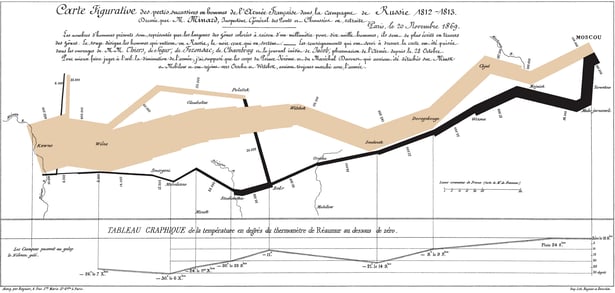
History is a subject that is enhanced by the use of visual representation, usually in the form of timelines and pictures that provide visual details regarding historical events and their surrounding contexts. One example of the use of visual representation is Charles Minard’s chart, created in 1869 of shows six data types related to Napoleon Bonaparte’s 1812 unsuccessful campaign against Russia:
 Image Source: WikiMedia
Students can take historical events and create similar multi-dimensional maps. With digital tools, they can embed links to on-line resources, such as primary sources, and also their own creations.
Science
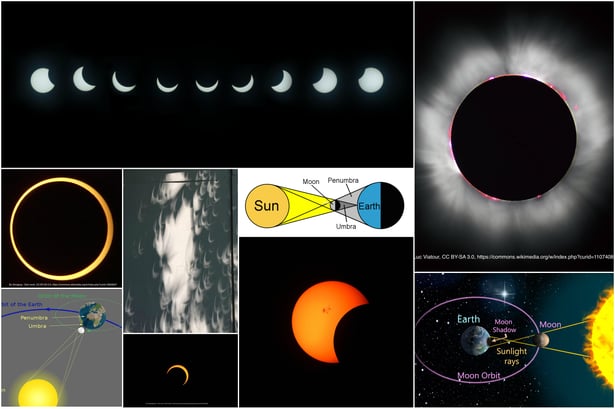
A recent solar eclipse generated many photos and visual representations of the eclipse process. In this example, a collage was created to show different aspects of the eclipse. Collages can be easily made by teachers and students through on-line resources such as BeFunky Collage Maker.

In addition to collages, science learning can be enhanced through visual strategies such exploring interactive diagrams, models, and simulations, as well as creating their own.
If you are a teacher interested in supporting visual thinking and learning among your students, take time to review some of the resources provided below.
Alternatively, if you'd like to learn more from Lynn Marentette, you can get in contact by clicking the following button:
Resources
Visible Thinking: Project Zero, Harvard Graduate School of Education
“Visible Thinking is a flexible and systematic research-based conceptual framework, which aims to integrate the development of students' thinking with content learning across subject matters.”
Jen Christiansen, Scientific American Blog, 11/3/15
Common Core in Action: 10 Visual Literacy Strategies
Concept Mapping in the Classroom
Kathy Schrock, Kathy Schrock’s Guide to Everything
UDL Strategies: Make Learning Visual
Charles Minard’s Flow Map of Napoleon’s Russian Campaign of 1812
Michael Sandberg, DataViz Blog, 5/26/13
Ben Jones, DataRemixed, 2/2/14
Further reading
Ainsworth S, Prain V, Tytler R. “Drawing to learn in science”. Science. 2011; 26:1096–1097.
Arnheim, R. (1969). Visual thinking. Univ of California Press.
Beatty, N. A. , "Cognitive Visual Literacy: From Theories and Competencies to Pedagogy," Art Documentation: Journal of the Art Libraries Society of North America 32, no. 1 (Spring 2013): 33-42.
Bobek, E., & Tversky, B. (2016). Creating visual explanations improves learning. Cognitive Research: Principles and Implications, 1(1), 27.
Brugar, K. A., & Roberts, K. L. (2017). Seeing is believing: promoting visual literacy in elementary social studies. Journal of Teacher Education, 68(3), 262-279.
Krechevsky, M., Mardell, B., Rivard, M., & Wilson, D. (2013). Visible learners: Promoting Reggio-inspired approaches in all schools. John Wiley & Sons.
Moorman, M. (2015). The meaning of visual thinking strategies for nursing students. Humanities, 4(4), 748-759.
Renkl, A., & Scheiter, K. (2017). Studying visual displays: How to instructionally support learning. Educational Psychology Review, 29(3), 599-621.
Ritchhart, R., Church, M., & Morrison, K. (2011). Making thinking visible: How to promote engagement, understanding, and independence for all learners. John Wiley & Sons.
Staley, D. J. (2015). Computers, visualization, and history: How new technology will transform our understanding of the past. Routledge.
Tippett, C. D. (2016). What recent research on diagrams suggests about learning with rather than learning from visual representations in science. International Journal of Science Education, 38(5), 725-746.
Wiseman, A. M., Mäkinen, M., & Kupiainen, R. (2016). Literacy through photography: Multimodal and visual literacy in a third grade classroom. Early Childhood Education Journal, 44(5), 537-544.

 3-in-1 Mic


